Graphing in Excel
The tutorial on the rEsource site gives some help on graphing, but I do not feel it to be the best way to go about it. There are a number of free programs that can be downloaded from the web to do graphing, but you can use Excel to do what is needed and not have to install anything else. Here is an example.
Let’s look at ![]() .
.
The x-coordinate of the vertex is
 .
.
The y-coordinate of the vertex is

Okay, so our vertex is ![]() and this is
the lowest point on the graph since
and this is
the lowest point on the graph since ![]() is positive.
is positive.
Now, let’s go to Excel!
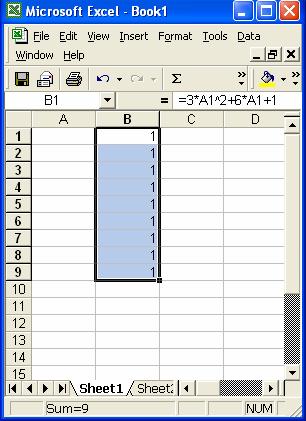
In row 1 column B, enter our quadratic like this:

Note: A1 is telling the formula to take the row 1 column A entry and insert it here; this acts like x.
After you press <enter>, your screen should look like this.

Now move the box back up to our entry using the arrow keys. Carefully place the tip of the cursor on the little black square in the lower right corner of the box so it changes to a giant +. Press the left mouse button and hold it down while you move straight down until the box includes row 9 column B, then release the mouse button. You should have this:
Now use the arrow keys to move the box to row 5 column, type –1 and press <enter>. You should have this.

Okay! Move up and down to enter more values making sure they are in numerical order from top to bottom. You should have something like this, but you do not have to have the same values I have.
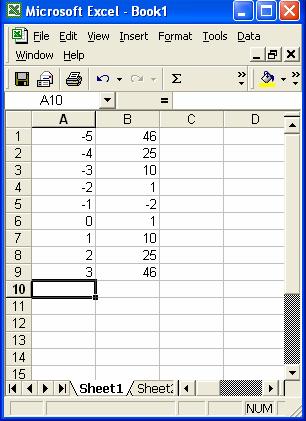
At this point, we have listed the vertex and four points on either side of the vertex. As a bonus, Excel has done the arithmetic for us!
Look across the top of the toolbar until you find Insert and click on it. In the drop-down menu that appears, select Chart. You should now have this screen.

Select XY (Scatter) from the list. And select he format with curves and points showing.

Now click Finish and your graph should appear! Close any unneeded windows or toolbars that also appear. The graph is a graphic object that you can click on and use copy and paste to place it in another document.

In fact, this can be done right here.

This is not a perfect solution to graphing these things, but it is one that takes very little time and effort once you are used to the steps. Of course, if you do not wish to deal with entering the formula and getting it right, you can calculate the coordinates yourself and just enter the x-coordinates in column A and the y-coordinates in column B.