Graphing Systems of Inequalities
As much as this is about the mathematics, it is also about the actual drawing of the graphs, too. Consequently, both aspects will be discussed here.
Suppose we are to solve the
following system of inequalities: 
Okay, the first thing we
find is that ![]() has
has ![]() as both its x-intercept
and its y-intercept. Therefore, we must find a second point in order to
be able to graph this equation. To find a second point, select any value for
as both its x-intercept
and its y-intercept. Therefore, we must find a second point in order to
be able to graph this equation. To find a second point, select any value for ![]() and compute
and compute ![]() , then
plot the point. Since this line is part of the solution set, we can draw it as
a solid line.
, then
plot the point. Since this line is part of the solution set, we can draw it as
a solid line.

This graph was created by first making a Master Graph as described in the PowerPoint tutorial, and then using “copy and paste” to copy the square that was the basic graph into Paint. In Paint, the eraser can be used to erase the grids and leave the line we drew. (Note: Knowing we need to draw a second line, it is wise to leave some points or marks so that the second line can be graphed, otherwise our accuracy suffers.)
Now that we have the line
and make sure that it extends all of the way to the edges of the field, we can
determine which side needs to be shaded by picking a test point, say ![]() .
.

Use the paint bucket after selecting a color to shade the appropriate area.

Now we need to get the other line into the picture
.

Seeing that we have solved
the equation for ![]() , we know that the
y-intercept is
, we know that the
y-intercept is ![]() and the slope is
and the slope is ![]() , so we
can plot this line on our graph as it is below.
, so we
can plot this line on our graph as it is below.
Now we need to determine
which side of this line to shade and we see that it does not go through the
origin, so we select ![]() as our test point.
as our test point.
![]()
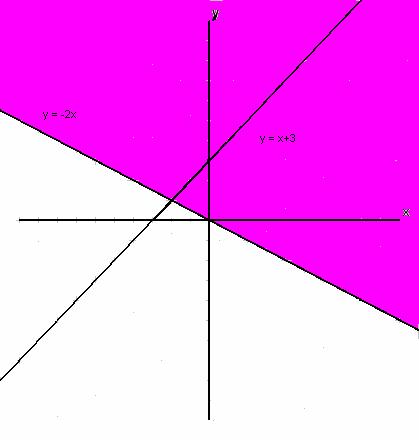
Okay, so we shade the other side of the line, and make the part that would have been shaded both times a third color to arrive at the following graph where violet was shaded from the first inequality, green was shaded from the second inequality, and orange was the part that was shaded both times..

As you can see, using Paint makes our graphs look a lot better than just shading the cells in Excel did, but it is more work.
In case anyone is uncertain, the orange area is the solution set.